Variance: How to Calculate It (Sample and Population), With Examples
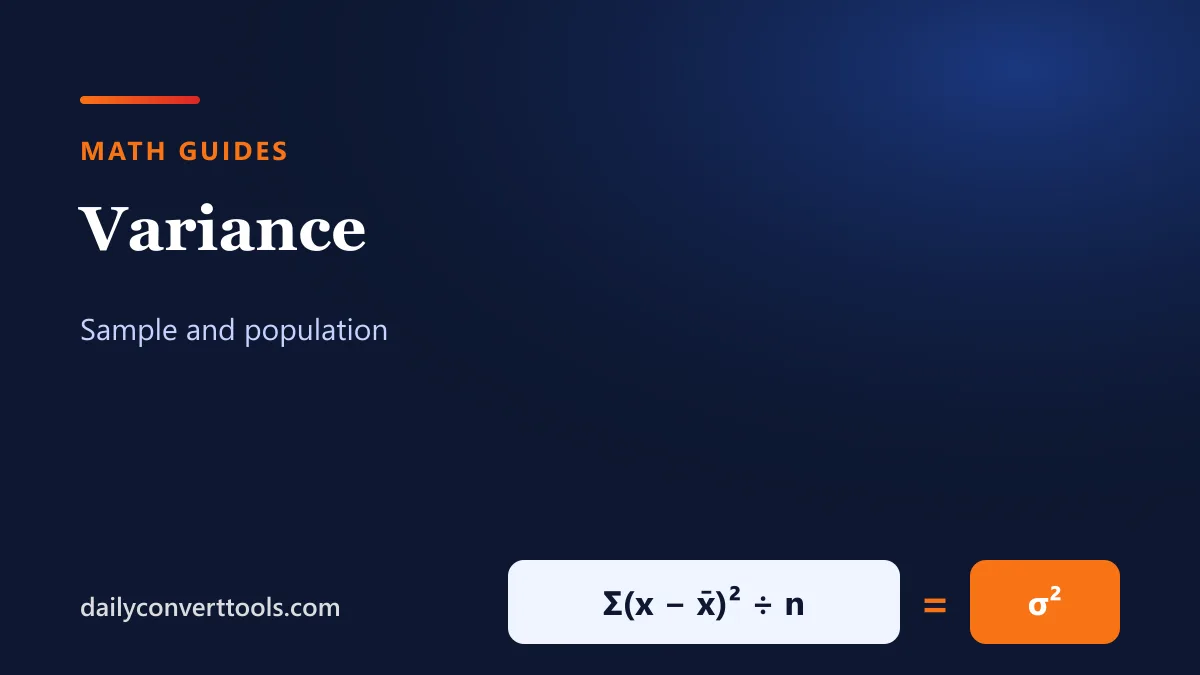
Variance measures how spread out a set of numbers is. Specifically, it’s the average of the squared distances from the mean, and its square root is the standard deviation, as the NIST/SEMATECH e-Handbook of Statistical Methods explains.
Quick answer
- Population: σ² = Σ(x − μ)² ÷ N
- Sample: s² = Σ(x − x̄)² ÷ (n − 1)
- Standard deviation = √σ².
Step-by-step example
Data: 4, 8, 6, 5, 3, 7, 9, 6.
- First, find the mean: 48 ÷ 8 = 6.
- Then subtract the mean from each value and square it (table below).
- Next, add the squares: 28.
- Finally, divide: the population figure is 28 ÷ 8 = 3.500, and the sample figure is 28 ÷ 7 = 4.000.
| Value | Value − mean | Squared |
|---|---|---|
| 4 | -2 | 4 |
| 8 | 2 | 4 |
| 6 | 0 | 0 |
| 5 | -1 | 1 |
| 3 | -3 | 9 |
| 7 | 1 | 1 |
| 9 | 3 | 9 |
| 6 | 0 | 0 |
Population or sample?
Divide by N when your data covers the whole group you care about. Divide by n − 1 when it’s a sample used to estimate a bigger population; the smaller denominator corrects for samples tending to underestimate spread (Bessel’s correction).
Variance vs standard deviation
- It’s in squared units (if data is in cm, σ² is in cm²), which is hard to interpret.
- Standard deviation is back in the original units, so it’s easier to explain: for this data, √4.000 ≈ 2.000 (sample).
- Even so, it matters because, for independent variables, these squared spreads add, which makes it handy in probability and finance.
See standard deviation for more.
In Excel or Google Sheets
- Sample variance:
=VAR.S(A1:A8)(or VAR in Google Sheets) - Population variance:
=VAR.P(A1:A8)(or VARP)
Shortcut formula
Alternatively, σ² equals the mean of the squares minus the square of the mean: σ² = (Σx² ÷ N) − μ². It’s quicker by hand for some data, but can lose accuracy on computers with very large numbers.
Frequently asked questions
What is variance?
The average squared distance of values from the mean.
How does it relate to standard deviation?
Standard deviation is its square root.
Why divide by n − 1 for a sample?
It corrects for samples tending to underestimate the population’s spread.
Can it be negative?
No. It’s an average of squares, so it’s zero or positive.